|
| Command: |
 Image Analysis > Classification > Random Decision Forest > Designer Image Analysis > Classification > Random Decision Forest > Designer |
Random Decision Forest (RDF) based classifiers are one of the most often used models for classification and are comparable in performance to PLS discriminant analysis. In order to create an RDF classifier you first have to define both a set of spectral descriptors and a set of training data.
| How To: |
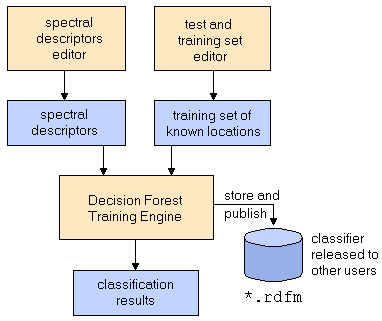
- Load the spectral desciptors by clicking the
 button. button.
- Load the training set by clicking the
 button. Hint: If you did not specify a training set so far, you can do so by clicking the button. Hint: If you did not specify a training set so far, you can do so by clicking the  button in the main window and prepare your set, before you proceed. button in the main window and prepare your set, before you proceed.
- Set the R parameter1) and the number of trees
- Optionally select a pixel mask (normally not required)
- Click the "Calculate"
 button. The modelling starts immediately and the calculated decision forest is applied to the currently loaded image. button. The modelling starts immediately and the calculated decision forest is applied to the currently loaded image.
- After the calculation has finished you should check the classification results for all classes. Be aware of the fact that RDFs cannot be excessively controlled by their parameters (the R parameter and the number of trees won't have much influence on the results). In the case of poor classification results you should adjust the spectral descriptors and/or the training data set.
- Save the trained classifier if it fits your requirements. Please note that the saved classifier can be encrypted in order to restrict the usage of the model.
|
|
Error types:
- RelClsError: Relative classification error - fraction of incorrectly classified cases: (FP+FN)/N
- AvgCE: Average cross-entropy (in bits per element)
- RMSError: root mean square error when estimating posterior probabilities (OOB: equivalent to RMS(CV) of cross validation)
- AvgError: Average error when estimating posterior probabilities
- AvgRelError: Average relative error when estimating posterior probability of belonging to the correct class
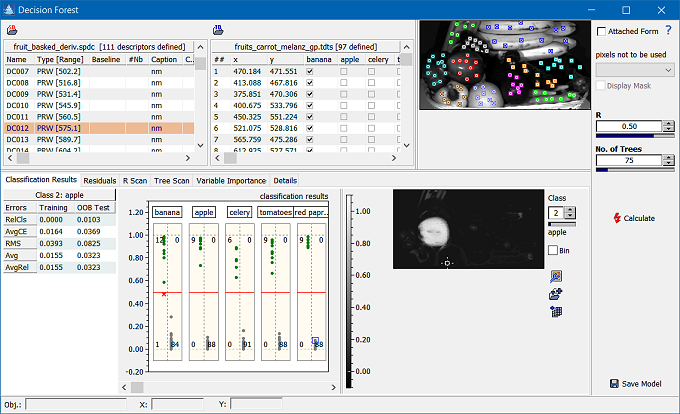
The upper part of the window shows the list of descriptors and a table containing the training data. The corresponding data points of the training dataset are depicted in the top right image. This image shows the currently selected descriptor. The lower half of the window shows the results of the classification on five tabs:
| Tab |
Description |
| Classification Results |
The plot on the left hand side depicts the confusion matrix for each class. If the actual and predicted classification coincide, the data point in question appears either in the upper left if the result is positive/positive or the lower right part of the matrix if the result is negative/negative. If the classification contradicts itself, the data point either appears in the lower left part or the upper right part, marked with a red x. The number inside each cell corresponds to the number of assigned data points. Please note that the confusion matrices displayed on this tab are transposed in comparison to how it is defined most often in the literature (here, the true values are on the x-axis, the estimated on y-axis). The plot on the right hand side depicts the classification for the currently selected class in a color coded form.
|
| Residuals |
This graph depicts the residual values for all test data points.
|
| R Scan |
If you are not sure about the optimum R value1) you can scan the allowed range of R values and display the results as a diagram. In many cases an R value of 0.5 delivers good results.
|
| Tree Scan |
The tree scan allows to find out how many trees should be used for the decision forest. For most problems you need between 50 and 100 trees.
|
| Variable Importance |
This tab provides information about the importance of the used descriptors to detect a selected class. See the section on variable importance for details.
|
| Cross Validation |
Though random forests provide inherent cross validation by means of the OOB probabilities these numbers have the disadvantage that you cannot easily recognize the precision of the estimates. In this respect, the built-in cross validation provides a simple but efficient means to estimate the confidence limits of the root mean square errors of prediction (which is comparable to OOB RMS[EP]) as well as the TP rate and the FP rate by performing cross validations several times.
|
| Details |
The details contain a numeric summary of the classification results. The classification errors, the variable importance, the actual and estimated traning data and the scans for the R-value and the number of trees are reported as text tables.
|
| Hint: |
The following video  shows how to create a classifier based on random forests. shows how to create a classifier based on random forests.
|
|
 Image Processing