
Features
Epina ImageLab supports all major spectroscopic imaging techniques, such as uv/vis, infrared, Raman, THz, optical emission and absorption, EDX (energy dispersive xray), and mass spectrometry.
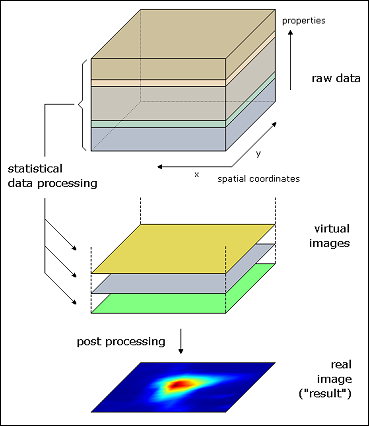 A plethora of built-in multivariate statistical methods enables the user to analyze and classify acquired hyperspectral images. Currently available multivariate techniques are:
- Principal Component Analysis (PCA)
- Cluster Analysis (dendrograms, k-means and fuzzy c-means)
- Correlation/Similarity Maps (SIMAP)
- PLS Discriminant Analysis (PLS/DA)
- Random Decision Forest (RDF)
- Vertex Component Analysis (VCA, endmember detection)
- Maximum Noise Fraction Transform (MNF)
All images - either deriving from raw data or statistical analyses - can be combined with conventional photos, thus creating an image stack consisting of up to eight layers. Using different algorithms and levels of transparency analytical information can be highlighted directly in the corresponding photo, making it much easier to recognize areas of interest.
As an aid to the researcher, Epina ImageLab provides several tools to pre-process and improve raw image data. If necessary images can be cut, resampled, mirrored and masked. A bad pixel finder helps to identify pixels which are invalid due to problems with the detector. Furthermore there are several tools which can be used to process the spectral information. The most important ones help you with baseline subtraction, smoothing, and the calculation of derivative spectra.
One particular strength of Epina ImageLab is based on so-called spectral descriptors, which help to introduce chemical and physical knowledge into the statistical analysis of the images. By defining spectral descriptors the multidimensional space describing the samples is augmented by additional variables. It has been shown that the classification of images becomes considerably more reliable by using spectral descriptors.
In addition to many other imaging software packages, Epina ImageLab also supports the time domain as a fourth dimension. Thus the user may visualize data over time, creating a video highlighting changes in the sample (provided that the sample can be measured without destruction).
Epina ImageLab provides a versatile and open programming interface allowing researchers to hook up their own data processing modules. The concept of user-defined modules can also be used to develop data import modules for any spectroscopic device.
Here's a list of the most important features of Epina ImageLab:
Data Processing
- various methods of importing and exporting data
- modular import filters for additional imaging devices
- smoothing of spectra and images
- spike recognition and removal
- denoising of images by maximum noise fraction transform (MNF)
- calculation of derivatives
- image correction to internal standards
- baseline correction (spline, polymomial and Lieber algorithm)
- built-in numerical data editor
- many predefined arithmetic conversions
- built-in calculator for applying arbitrary mathematical formulas to the image data
Image Analysis
- support of multisensor imaging
- detection and interpolation of bad pixels
- principal component analysis (PCA)
- classification of image structures by means of PLS discriminant analysis (PLS-DA) and random forests
- similarity maps
- clustering methods (dendrograms, k-means and fuzzy c-means)
- "chemical maps"
- regression of spectral images
- vertex component analysis (VCA)
- various pre-defined images (variance map, total intensity plot, suspicious pixels detector)
- signal distribution analysis
Visualisation of Data
- both images and spectra can be displayed side by side
- a flexible mask editor allows to (de)select individual pixels
- projection of calculated spectral images onto photos or maps
- image fusion applied to a maximum of eight layers
- 3D rotatable surfaces
Various Features
- automatic update feature
- user supplied modules enable the extension of Epina ImageLab according to the specific needs of the user