Home  Image Processing Time Delay Map Image Processing Time Delay Map |
||||||
 |
||||||
  |
||||||
Time Delay Map |
||||||
|
The time delay (TD) map is typically used to visualize the thickness of some material, or other physical properties which cause a time shift of pulsed excitation signals. Each pixel of a TD map contains the time shift exhibited at the particular position of the material. The time shift is calculated by measuring the difference in the between a reference point and the intersection of the signal with a user-defined threshold L1. The reference point can be either zero (see figure below, left) or derived from a second threshold L2 (right).
|
||||||
 Image Analysis > Special Images > Time Delay Map
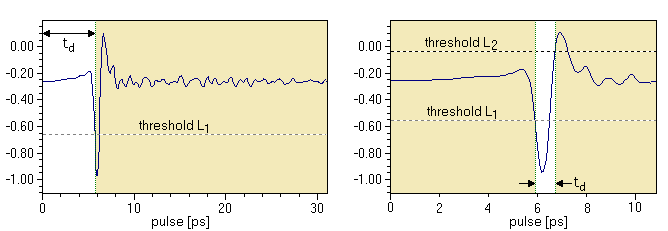
 ), or to the
  );
);
