Home  Spectral Database Spectral Display Spectral Database Spectral Display |
||
 |
||
  |
||
Database Spectral Display |
 |
|
|
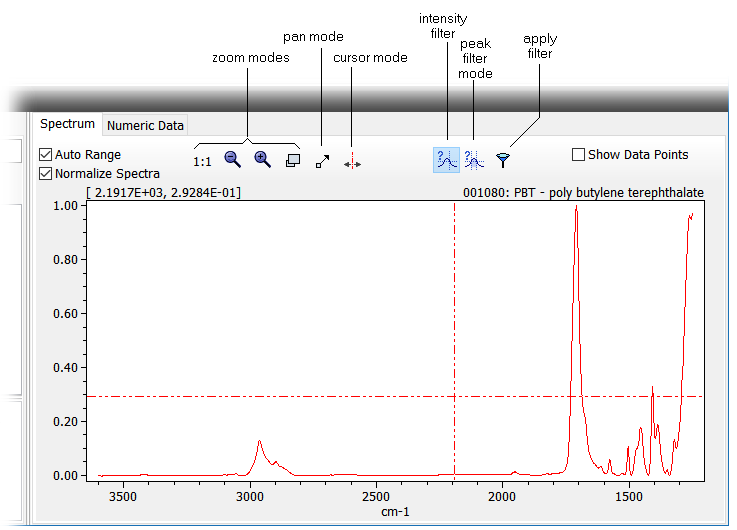
The spectral display of the database can be used to display and compare database entries and to narrow down the database list by specifying the parameters of the intensity and the peak search filter.
Options:
|
||