Home  Spectral Database Filtering the Database List Spectral Database Filtering the Database List |
||
See also: Database Introduction
 |
||
  |
||
Filtering the Database List |
 |
|
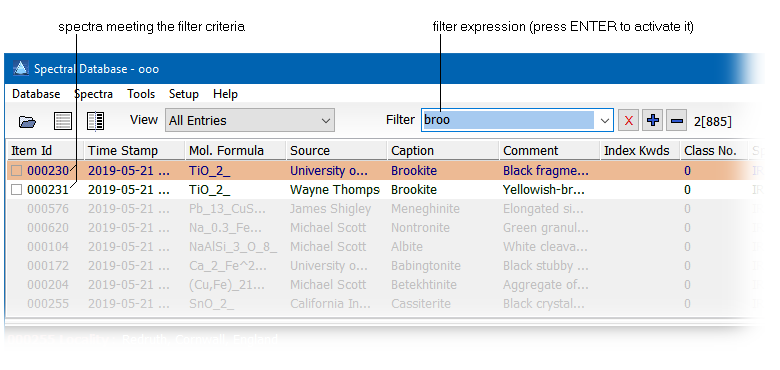
In order to narrow down the list of displayed spectra you can define a filter which reduces the number displayed spectra to those spectra which meet the filter criteria. The filter can be operated in three different modes:
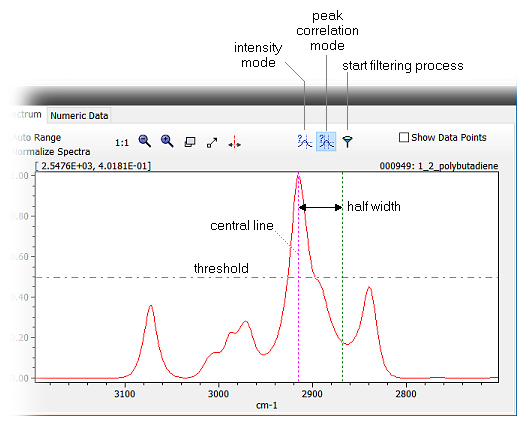
There are two different modes of filtering: a simple substring search and a logical combination search. Whether the filter control accepts a logical combination or not depends on the settings in the preferences. If the option "Filter Mode for Text Filters" is set to "Logical Combinations" kind of boolean expressions are allowed (see Logical Combinations in Filter Expressions for more). The logical expression mode is indicated by a blueish background of the control. Intensity Search: The filter can be used to display spectra which exhibit a spectral intensity (of normalized spectra) which is either below or above a particular threshold. The syntax for this kind of filter is a boolean expression like this: Int[wl] < thresh or Int[wl] > thresh, where wl denotes the wavelength and thresh denotes the threshold for the comparison. Example: Int [834.2] > 0.69. Peak Search: This filter mode allows to search for peaks of a specified minimum intensity and a Gaussian form with a particular center and half width. The syntax for this kind of filter is a boolean expression like this: Peak[wl,hw] > thresh, where wl specifies the central wavelength of the expected peak and hw defines the halfwidth of it. The parameter thresh denotes the minimum expected peak intensity. Please note that in order to recognized as a peak the correlation coefficient between the actual data within the specified window wl+/-hw and an idealized Gaussian peak of the same position and width has to exceed 0.8. Please note that the intensity search and the peak search can be set interactively in the spectral window as well: first select the filter mode, then set the central line, the halfwidth (in the case of a peak search) and the threshold and then click the start filtering process button. This generates the corresponding filter expression and starts the search.
|
||