Home  Script Language Display Functions ChartBook Charts Using the Charts Script Language Display Functions ChartBook Charts Using the Charts |
||||
See also: Reset, Chartbook, Using the ChartBook, Using the Tables
 |
||||
  |
||||
Using the Charts |
 |
|||
|
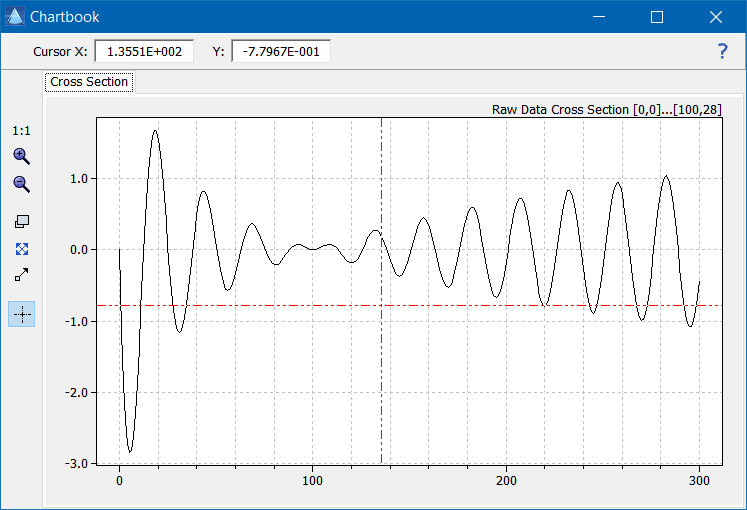
The charts in the ChartBook can be accessed via ILabPascal by using the array property ChartBook.Charts[idx] and its subproperties (with idx as the tab number). The charts in the ChartBook are easy-to-use scientific chart components which provide the most basic features in order to display x-y diagrams using arbitrary coordinate systems. By default each chart is aligned so as to fit its container; the containers can be adusted by means of the method Configure. However, you can change the default alignment by adjusting the property Align together with the properties Left, Top, Height and Width. Each chart of the ChartBook provides the following features which can be controlled by their corresponding properties and methods:
A chart stores all the graphics elements drawn on it in a data container. This ensures that these elements can be automatically redrawn if e.g. the coordinate system or the extents of the chart area are changed. The following graphic elements (also called items in the program code) are currently available:
Each of these elements has at least three implicit attributes which are either set by some method of the chart or are derived from some class properties at run-time: the position of the element (in the real coordinate system of the associated chart layer), its color, and the number of the class it belongs to. The class numbers are initially set to the ClassDefault property and can be used to differentiate between groups of drawing elements. Graphic elements of some classes may be selectively hidden by setting the array property ClassVisible accordingly. The ChartBook offers a flexible way to draw differently scaled data in a common diagram: each chart of the ChartBook allows to activate up to 16 independently scaled (both in x and y) layers which are plotted on top of each other. Each layer has two independent axes which may or may not be displayed. The properties of the axes are controlled by the array properties ScalePropsX and ScalePropsY. The drawing always takes place in the active layer which is specified by the property ActiveLayer. You may switch off the visibility of a particular layer by setting the array property LayerVisibility. The charts provide an efficient and easy-to-handle algorithm for labeling the axes. The inscription of the axes is automatically generated in a way that the scale ticks always are placed on multiples of the numbers 1, 2, and 5. This avoids an effect often seen in other packages which creates inscriptions like "-0.124 -0.001 0.122 0.245 0.368" instead of "-0.1 0.0 0.1 0.2 0.3". The user only has to specify the intended minimum number of scale ticks (properties ScalePropsX[].MinTicks and ScalePropsY[].MinTicks), and the bounds of the axes (ScalePropsX[].RangeLow, ScalePropsY[].RangeLow, ScalePropsX[].RangeHigh, ScalePropsY[].RangeHigh). As an alternative, the method AutoRange may be used to set the bounds of the chart axes such that all graphic elements are visible. ChartBook offers several predefined layouts of the axes which can be set by means of the method SetAxisLayout. The ChartBook provides a simple but efficient means to suppress flickering when drawing new items. By default, drawing on a chart is done in the off; the results must be explicitly copied to the visible screen window by calling the method Update. Of course, there are a few exceptions to this general rule: the chart is automatically redrawn when you change any properties which effect the appearance of the drawing (type of scaling, colors, grid, ...). In order to completely suppress any redrawing during the construction of a chart you can set the property SuppressPaint to TRUE. A chart can be copied to the Windows clipboard by means of the method CopyToClipboard. The axes may also be manipulated interactively by setting the property MouseAction accordingly. The array property MouseAffectsLayer controls which layers are affected by the mouse interaction.
|
||||