Home  Introduction Frequently Asked Questions Introduction Frequently Asked Questions |
||
 |
||
  |
||
Frequently Asked Questions |
||
|
What is the difference of images in the 2D Imager and the Image Stack? The 2D Imager displays images based on single wavelengths or other physical properties. You can retrieve the data or even edit it in the data editor. In contrast, the image stack is solely for superimposing various pictures. So the Image Stack works with "images" (in the sense of a photo) while the 2D Imager works with data (which are displayed as images).
Why are cluster images always tied to their actual pixel resolution, while other images show (much nicer) interpolated colors? If there are more than two classes the interpolation of class numbers (which is equivalent to interpolating the corresponding colors) is more or less nonsense. A simple example should clarify this: suppose you have three classes which form three clusters located in a triangualar configuration. Interpolating between class one and class three will result in an interpolated class two between these two clusters - which does not reflect the actual situation. Thus it is better to stick with pixels. If I import an image of 20 by 20 pixels, Epina ImageLab displays only 19 by 19 pixels. Is this a bug? No it's not. Pixels are considered to be infinitesimally small support points of the surface to be measured. Epina ImageLab uses these points and estimates the surface between the support points. Thus a grid of 20 by 20 measurements results in 19 by 19 surface elements (which can be displayed as contant-height rectangles by selecting the "pixels" option in the image setup dialog). How can I change the default color palette for the images? Go to "Setup/Preferences" and select the default color palette in this window. The default color palette is used whenever no other palette is assigned to an image. If you experience trouble with color reception you may try to switch to the "MorgenStemning" color palette which has been designed especially for users suffering from color reception deficiencies. Why do I have to define spectral descriptors, why not use the raw intensities? Spectral descriptors can considerably improve the performance of multivariate methods for the interpretation of hyperspectral images. We recommend to configure a set of spectral descriptors for each kind of problem and/or sample. This way the effort of selecting spectral descriptors can be minimized while the results improve significantly. For more, please read the background information on spectral descriptors. When copying an image to the clipboard (command "Copy to Clipboard" of the context menu) the crosshair cursor is copied as well. Can this be avoided? Yes, simply move the crosshair outside the chart, then right click the window and select "Copy to Clipboard". How can I convert my IR spectra from absorbance units to percent transmission? Open the predefined transformations dialog (command Preprocessing>Predefined Arithmetic Conversions) and select the appropriate conversion mode. How can I add normally distributed noise to the image data? There are three ways to do so: (1) using the built-in calculator, (2) using the bulk tranform tool and (3) writing a small program in ILabPascal. See the section "How to Add Noise" for more. How can I check if there are any remaining spikes after the spike removal tool has been used? Spikes show high variances, a fact which can be used to detect remaining spikes not discovered by the spike removal tool. Simply calculate an average spectrum of the entire image and look at the confidence band of the mean. Spikes will be indicated by an significant increase of the width of the confidence band. What is q-normalisation? Q-normalisation is comparable to standardisation, using the median and the difference between the median and the 0.95 quantile instead of the mean and the standard deviation. Q-normalized data are less prone to outliers, since outliers would fall outside the 0.95 quantile if the number of outliers is less than 5% of all data values. See the scaling of the data for details. I have a huge hyperspectral image (4 million spectra) and Epina ImageLab runs into a memory overflow problem. What can I do? You have basically two options: (1) use the 64-bit version of Epina ImageLab (see the comparison of features), or (2) resample your data. The second method is in general a better approach as the processing time of many algorithms scales with the square of the number of pixels. If you cannot resample because of the high density of information in your data, another way is to process only parts of an image. How can I create logical combinations of pixel masks? Logical combinations of pixel masks can be calculated either by means of the mask editor or by using the Epina ImageLab scripting engine (see the Script Library - Pixel Masks). What about the speed of scripts. The execution speed of scripts is about 30% lower than that of native code. However, while this slowdown may seem to be a high toll, it is in fact not if you compare it to classical interpreted scripts which are typically slower by a factor of 10 or more. The high execution speed of Epina ImageLab scripts is achieved by compiling the script code before executing it. The generation of the PCA details is so slow. Larger matrices cause a correspondingly large report on the details page of the PCA. The creation of this report can take several seconds. You can switch off the PCA details in the preferences dialog (set the option "Max. No. of PCA Eigenvalues in Protocol" to 20). The color scale changes a little bit if I toggle the "Auto Color" checkbox several times. In order to provide fast response, the "Auto Color" function calculates the optimum span of the color scale by drawing a random sample of all pixels of an image. Due to the inherent random nature of this process the color scale changes slightly each time the color normalisation is performed. You can adjust the limit above which random sampling of the colors occurs in the preferences dialog (option "Sampline Limit - Color Scales"). Is there an option to tighly connect the photo and the hyperspectral image in the 2D Imager so that both show the same region of an image? No there is no such option. In general, the hyperspectral image and the photo may be rotated against each other which makes it impossible to lock both images. Hint: Use the image stack for this purpose. When copying an image to the image stack it is automatically rotated and scaled to exactly match the photo. |
||
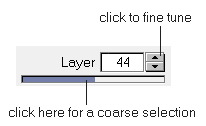 Why is it impossible to directly enter a specific layer number?